
In this post, we explore a question being discussed in a number of insurance and investment manager’s offices. Are the scenarios under the PRIIPs regulation realistic?
Many key industry leaders have publicly stated they believe the scenarios are overstating future results. In this post, we examine whether they are correct.

The recent introduction of PRIIPs KIDs in January 2018 has been anything but smooth for many PRIIP manufacturers. One item of significant concern for the manufacturers is the approach used for performance scenarios. This requires manufacturers to apply a set of prescribed formulae to a 5-year price history. Many manufacturers have noted that historic returns are not a good indicator for future returns and that the last 5-years has represented a significant bull market.
This prompted many manufacturers to contact the FCA expressing their concerns. The response from the FCA was to encourage manufacturers to add bespoke guidance on the numbers outlined in their KIDs.
As a result, many KIDs are now being produced with custom ‘health warnings’ accompanying the numbers in their performance scenario table. Often these warnings direct prospective clients back to existing sales materials. Some would say that this distracts from the KID – maybe purposefully so to avoid having to discuss the numbers in the KID?
But before one jumps to the conclusion that the manufacturers are acting to deceive or distract their prospective clients, consider the numbers we have outlined below. And consider the predicament PRIIPs has put the manufacturers in – they are being forced to give prospective clients predicted returns that they don’t believe are achievable and that they believe to be misleading – our investigations below gives credence to these concerns.
FCA statement Jan 2018
“Where a PRIIP manufacturer is concerned that performance scenarios in their KID are too optimistic, such that they may mislead investors, we are comfortable with them providing explanatory materials to put the calculations in context and to set out their concerns for investors to consider.”
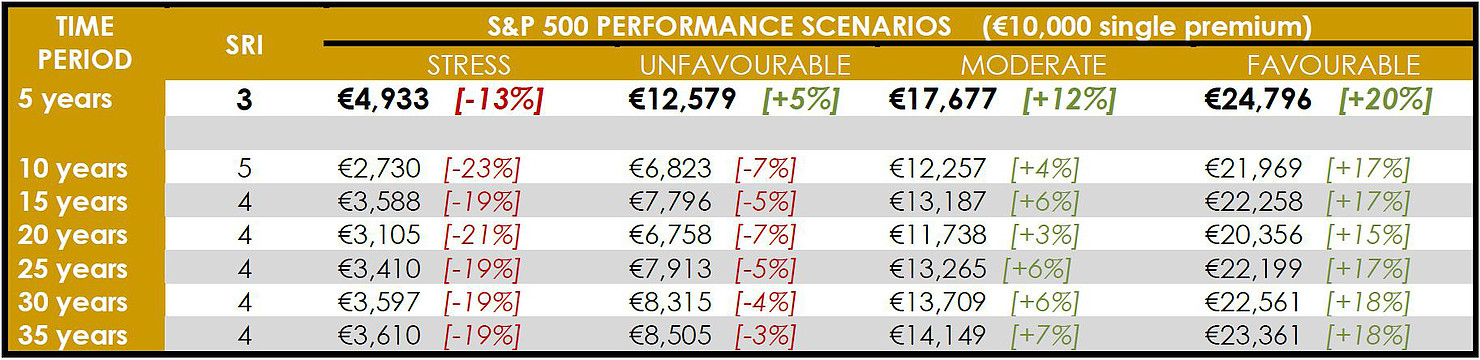
We applied the PRIIPs formulae to prices for the S&P 500 over a number of time periods from 5 years to 35 years.
Our analysis shows a number of key insights which illustrates the manufacturer’s concerns that the numbers in their KIDs (based on a 5-year price history) are over optimistic – with even unfavourable scenarios showing positive expected performance.
Key Insights:
- 5-yrs price history shows an SRI of 3 – all other periods have SRI of 4+.
- 5-yrs price history shows by far the most favourable projections.
- All non-stress scenarios show positive returns for 5-yrs prices.
